
 “The fact that the last eleven years were the warmest on record provides further evidence of the unmistakable trend towards a hotter climate. The world is rapidly approaching the long-term temperature limit set by the Paris agreement. We are bound to pass it; the choice we now have is how to best manage the inevitable overshoot and its consequences on societies and natural systems.” – Carlo Buontempo, Director of the Copernicus Climate Change Service
“Rising concentrations of greenhouse gases in the atmosphere5 – mainly a direct consequence of human activities – are the primary driver of the observed long-term increase in the global mean temperature.” – Laurence Rouil, Director of Copernicus Atmosphere Monitoring Service at ECMWF
News from Copernicus, the Earth observation component of the European Union’s Space program
Posted January 21st, 2026 on Niagara At Large
 Copernicus data show that 2025 was the third warmest year on record1, only marginally (0.01°C) cooler than 2023, and 0.13°C cooler than 2024 – the warmest year on record. The past 11 years have been the 11 warmest on record.
Global temperatures from the past three years (2023-2025) averaged more than 1.5°C above the pre-industrial level (1850–1900). This marks the first time a three-year period has exceeded the 1.5°C limit. Air temperature over global land areas was second warmest, whilst the Antarctic saw its warmest annual temperature on record and the Arctic its 2nd warmest.
The findings are released today by the European Centre for Medium-Range Weather Forecasts (ECMWF), which operates the Copernicus Climate Change Service (C3S) and Copernicus Atmosphere Monitoring Service (CAMS) on behalf of the European Commission. The following organisations involved in global climate monitoring – ECMWF, NASA, NOAA, the UK Met Office, Berkeley Earth, and the World Meteorological Organisation (WMO) – have coordinated the release of their data.
Global surface air temperature increase (ºC) above the average for the 1850–1900 designated pre-industrial reference period based on the ERA5 dataset, shown as annual averages since 1940. Credit: C3S/ECMWF.
In 2025, according to ERA5, the global surface air temperature was 1.47°C above the pre-industrial level, following 1.60°C in 2024, the warmest year on record. Utilising several methods, the current level of long-term global warming is estimated to be around 1.4°C above the pre-industrial level.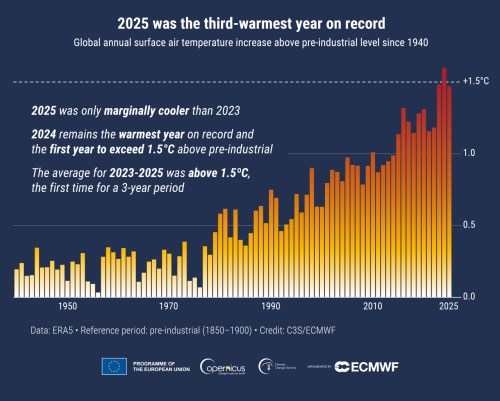
Based on the current rate of warming, the Paris Agreement’s limit of 1.5°C for long-term global warming could be reached by the end of this decade – over a decade earlier than predicted based on the rate of warming at the time the agreement was signed.
Anomalies and extremes in surface air temperature for 2025, 2023 and 2024. Colour categories refer to the percentiles of the temperature distributions for the 1991–2020 reference period. The extreme (“Coolest” and “Warmest”) categories are based on rankings for the period 1979–2025. Data source: ERA5. Credit: C3S/ECMWF.
The last three years 2023-2025 were exceptionally warm for two main reasons.
The first is the build-up of greenhouse gases in the atmosphere, from continued emissions and reduced uptake of carbon dioxide by natural sinks.
Secondly, sea-surface temperatures reached exceptionally high levels across the ocean, associated with an El Niño event and other ocean variability factors, amplified by climate change. Additional factors include changes in the amounts of aerosols and low cloud and variations in atmospheric circulation.
As in 2023 and 2024, a significant fraction of the globe was much warmer than average in 2025. Air and sea surface temperatures in the tropics were lower than in 2023 and 2024, yet still much above average in many areas outside of the tropics.
The lower tropical temperatures compared to 2023-2024 were partly due to the persistence of near-average (‘ENSO-neutral’) or weak La Niña conditions in the equatorial Pacific throughout 2025.
The higher temperatures of the two previous years were partially influenced by a strong El Niño event. El Niño tends to have a warming effect on global temperatures, superimposed on long-term human-caused global warming, whereas La Niña tends to have the opposite effect. Temperatures over the tropical Atlantic and Indian Ocean were also less extreme in 2025 than in 2024.
Higher temperatures in the polar regions partly offset the lower temperatures observed in tropical regions during 2025. The annual average temperatures reached their highest value on record in the Antarctic2, and their second-highest in the Arctic2. Record-high annual temperatures were also observed in several other regions, notably in the northwestern and southwestern Pacific, the northeastern Atlantic, far eastern and north-western Europe and central Asia.
“This report confirms that Europe and the world are in the warmest decade on record and that the European Commission’s investment in Copernicus continues to be critical. As an international organization serving 35 nations, ECMWF provides the world leading science for informed decisions to be made, and ultimately action taken, to adapt to climate change, because every year and every degree counts.
“Preparedness and prevention remain possible but only when action is guided by robust, scientific evidence.” – Florian Pappenberger, ECMWF Director-General
In 2025, half of the global land area experienced more days than average with at least strong heat stress – defined as feels-like temperature of 32°C or above. Heat stress is recognized by the WHO (World Health Organization) was the leading cause of global weather-related deaths3.
In areas with dry and often windy conditions, high temperatures also contributed to the spread and intensification of exceptional wildfires, which produce carbon, toxic air pollutants like particulate matter, and ozone, which impacts human health.
This was the case in parts of Europe – which experienced its highest annual total wildfire emissions – and North America, according to CAMS data. These emissions significantly degraded air quality and had potentially harmful impacts on human health at both the local and larger scales.
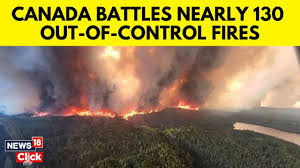
Wildfires rage across Canada, Europe and other regions of the world in 2025.
The exceptional conditions of 2025 come in a year marked by notable extreme events across many regions, including record heatwaves, severe storms in Europe, Asia and Norweather-related deaths in America, and wildfires in Spain, Canada and Southern California. While these individual events are not analysed or attributed in the report, they provide timely context for the growing public attention on climate risks in 20254.
Additional data from the 2025 Global Climate Highlights report:
Global temperature
- The global average temperature in 2025 was 14.97°C, 0.59°C above the 1991-2020 average, 0.13°C below 2024, the warmest year on record.
- Air temperature above global land areas was second warmest, 0.20ºC cooler than 2024 and 0.01ºC above 2023.
- Global sea-surface temperature (extrapolar) was 20.73ºC and third warmest after 2024 and 2023.
January 2025 was globally the warmest January on record. March, April and May were each the second warmest for the time of year. Each month of the year, except for February and December, was warmer than the corresponding month in any year before 2023.
Europe
2025 was the third-warmest year on record for Europe, with an average temperature of 10.41°C, 1.17°C above the average for the 1991-2020 reference period and 0.30°C below the warmest year, in 2024.
Sea ice extent
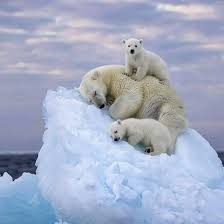
Polar Bears struggle to survive on melting ice caps
In February 2025, the combined sea ice cover from both poles fell to its lowest value since at least the start of satellite observations in the late 1970’s.
In the Arctic, the monthly sea ice extent was the lowest on record for the time of year in January, February, March, and December, and the second lowest in June and October. March marked the lowest annual maximum on record, while the September minimum ranked only 13th lowest.
In the Antarctic, the monthly extent reached its fourth-lowest annual minimum in February and its third-lowest annual maximum in September.
More information about the data can be found here.
More information on the reference period used can be found here.
About Copernicus and ECMWF – Copernicus is the Earth observation component of the European Union’s Space program, looking at our planet and its environment to benefit all European citizens. The program is coordinated and managed by the European Commission and implemented in partnership with the Member States and European organisations.
The European Centre for Medium-Range Weather Forecasts (ECMWF) is both a research institute and a 24/7 operational service, producing global numerical weather predictions and other data for our Member and Co-operating States and the broader community. It operates a world-class supercomputer facility for weather forecasting and holds one of the largest meteorological data archives.
ECMWF is a key player in Copernicus, the Earth Observation component of the European Union’s Space programme, by implementing quality-assured information on climate change (Copernicus Climate Change Service), atmospheric composition (Copernicus Atmosphere Monitoring Service), and contributing to information on flooding and fire danger (Copernicus Emergency Management Service). Together with ESA and EUMETSAT, ECMWF also delivers the EU’s Destination Earth initiative, which is developing prototype digital twins of the Earth.
More information on Copernicus: www.copernicus.eu
The ECMWF website can be found at https://www.ecmwf.int/
NIAGARA AT LARGE Encourages You To Join The Conversation By Sharing Your Views On This Post In The Space Below and by sharing the Niagara At Large site at www.niagaraatlarge.com with all of your friends and associates.
Visit us every day on www.niagaraat.arge.com and on Doug Draper’s Facebook page at https://www.facebook.com/doug.draper.180 and encourage everyone else you know to do the same. Let’s build local news and commentary media!
